Displaying Data Using Feature Layers
This is the third post in a series of posts regarding the ESRI JavaScript API and creating maps on the web. The second one was on how to draw a single point on the map. In this post, I’ll go a little more in depth on displaying some useful data on the map because that’s what makes maps useful.
What is a Feature Layer?
Graphics layers don’t have data, or attributes, attached to what gets put on the map. When tiled and map service layers are drawn, the server responds with just a PNG tile of what that area of the map looks like. Since we can’t attach data to specifics spots on a PNG, it makes sense that there needs to be a layer that supports that. Instead of being an array of images, a Feature layer is represented by a JSON object that contains an array of features as well as other properties needed by the layer. A feature being the object being represented on the map. A Feature layer does inherit from the Graphics layer since it as well needs geometry and a symbol to represent the feature’s location.
Feature layers can be created using two different methods. The first is that it’s pointed at a url which is served up by an ArcServer REST endpoint. This url is a specific layer inside a map service. This method I’ll cover in a later post. The second way is building the JSON object, which is called a Feature Collection, manually. This gives us the flexibility of serving up our own data as long as there’s a geometry attached to the data. There are advantages and disadvantages to both ways. The main disadvantage we get with doing it manually is that we lose the ability to use the built in functionality for editing and querying of the data. These would have to be handled manually as well. I’ll go over how to handle this.
Creating a Feature Collection
As I mentioned, the Feature Collection is just a large, predefined JSON object. Here’s an example of one from one of ESRI’s samples:
//create a feature collection for the flickr photos
var featureCollection = {
  "layerDefinition": null,
  "featureSet": {
    "features": [],
    "geometryType": "esriGeometryPoint"
  }
};
featureCollection.layerDefinition = {
  "geometryType": "esriGeometryPoint",
  "objectIdField": "ObjectID",
  "drawingInfo": {
    "renderer": {
      "type": "simple",
      "symbol": {
        "type": "esriPMS",
        "url": "images/flickr.png",
        "contentType": "image/png",
        "width": 15,
        "height": 15
      }
    }
  },
  "fields": [{
    "name": "ObjectID",
    "alias": "ObjectID",
    "type": "esriFieldTypeOID"
  }, {
    "name": "description",
    "alias": "Description",
    "type": "esriFieldTypeString"
  }, {
    "name": "title",
    "alias": "Title",
    "type": "esriFieldTypeString"
  }]
};
There’s much more than can be done but this shows a pretty simple example. It all starts with the Feature Collection base object:
layerDefinition: Pretty much what it’s called. It defines the map layer information.geometryType: The feature geometry type (i.e. point, polyline, or polygon).objectIdField: This will be the ID field that will get automatically assigned to each of the features. We will visit this in the next section.drawingInfo: The renderer the layer will use when drawing the features on the map. An explanation of the renderer can be found here.fields: The array of fields the features will have. More about the fields can be found here.
featureSet: The array of features and the geometry type is needed again.
Create a Feature Set
before, require two things, geometry (or location), and a symbol (for drawing). In a feature set, these graphics still need geometry in which the geometry type needs to match the geometry type of the layer you’re trying to create. The symbol is optional in that the layer has its own renderer defined so the feature can use that instead. The third piece a graphic can have are attributes. The list of fields defined by the layer definition tells the layer what attributes to expect from each graphic. Attributes for a graphic are set by using a simple JSON object.
Using our example definition above, here’s what an array of features might look like:
features: [
    {
        geometry: { x: 111, y: 222 },
        attributes: { name: "Feature 1", description: "My First Feature" }
    },
    {
        geometry: { x: 333, y: 444 },
        attributes: { name: "Feature 2", description: "My Second Feature" }
    },
    {
        geometry: { x: 555, y: 666 },
        attributes: { name: "Feature 3", description: "My Third Feature" }
    }
];
This is a really simple example, but there’s quite a bit of customization that you can do.
My Own Example
<title>Feature Collection Example</title>
<link rel="stylesheet" href="//js.arcgis.com/3.9/js/esri/css/esri.css">
<style type="text/css">
    body, #map { position: absolute; top: 0; left: 0; right: 0; bottom: 0; }
</style>

<div id="map"></div>
<script src="//js.arcgis.com/3.9/"></script>
<script type="text/javascript">
    require(['esri/map', 'esri/layers/FeatureLayer', 'dojo/text!./layer.json'], function (Map, FeatureLayer, layerDefinition) {
        var definition = JSON.parse(layerDefinition);
        var map = new Map('map', {
            basemap: 'streets',
            center: [-98.5795, 39.8282],
            zoom: 4
        });
        var layer = new FeatureLayer(definition, { id: 'MyLayer' });
        map.on('load', function () {
            map.addLayer(layer);
        });
    });
</script>
{
  "layerDefinition": {
    "geometryType": "esriGeometryPoint",
    "drawingInfo": {
      "renderer": {
        "type": "simple",
        "symbol": {
          "type": "esriPMS",
          "url": "marker.png",
          "contentType": "image/png",
          "width": 30,
          "height": 30
        }
      }
    },
    "fields": [{
      "name": "id",
      "alias": "ID",
      "type": "esriFieldTypeOID"
    }, {
      "name": "title",
      "alias": "Title",
      "type": "esriFieldTypeString"
    }]
  },
  "featureSet": {
    "features": [
      { "geometry": { "x": -8155495.379532158, "y": 5075380.311392084 },  "attributes": { "id": 1, "name": "New York" } },
      { "geometry": { "x": -9805495.379532158, "y": 5075380.311392084 },  "attributes": { "id": 2, "name": "Chicago" } },
      { "geometry": { "x": -13055495.379532158, "y": 3975380.311392084 },  "attributes": { "id": 3, "name": "Los Angeles" } }
    ],
    "geometryType": "esriGeometryPoint"
  }
}
Result
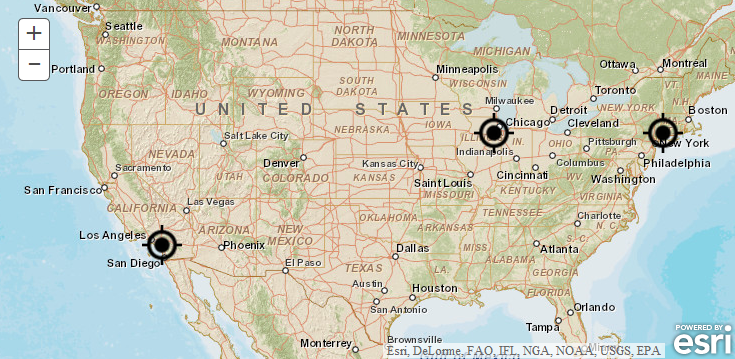
The points, as shown above, should mark New York City, Los Angeles, and Chicago. I used a png I found online for the marker, but you can use any image you want or you can swap it out with a color symbol.
Wrap Up
There’s more I want to go over, especially on editing, adding, and deleting features using the map. As well as show a read only popup of the data contained within a feature. Since this post is getting kind of lengthy, I’ll delegate that to a future post. So make sure to keep checking back. Any typos, corrections, or if anything can be done better, let me know in the comments or on Twitter.