Crash Course in the Node Debugger
Stop using console.log in your Node.js code!
If you’re like me, you did JavaScript development in context of the browser before moving over to the server. Using the console object for debugging is perfectly acceptable. What most new Node developers not realize, is that Node comes with its own debugger that is extremely helpful but not that straightforward to use.
What I hope to do is to give a crash course in using the debugger that will make using the debugger easier and enable you to stop having to use log statements everywhere.
Run Using Node Debugger
Let’s say I want to debug the following code:
var http = require("http");

function onRequest(request, response) {
  response.writeHead(200, {"Content-Type": "text/plain"});
  response.write("Hello World");
  response.end();
}

http.createServer(onRequest).listen(8888);
This is a basic http server that writes out ‘Hello World’ anytime it’s accessed.
Normally, you would run this file by using the node command: node server.js. To run using the debugger, the command is node debug server.js . Notice the debug in-between the command and the file. That starts the Node debugger running the indicated file.
You’ll get the following prompt:
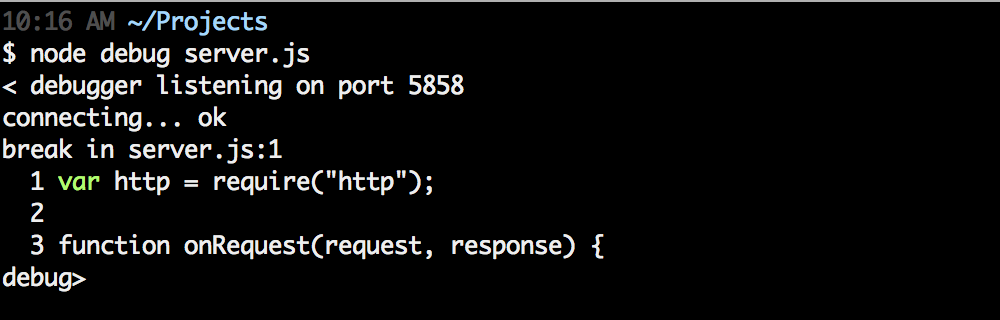
There’s a few items to note.
The first being the port number it says it’s listening on. The debugger does run out of the current process via TCP. What does that mean? It means the debugger can be accessed and controller remotely if you wanted to do that. This is out of scope of what I’m going to talk about here, but just know that the possibility is there.
The next piece is the file, line, and context of where it broke. It automatically stops on the first line it encounters.
Debugger Basics
The Node debugger gives you all the same functionality that every other basic debugger has. You can step in and out of functions, set breakpoints, and specify watches. To get a list of commands available to you while debugging, type help and press enter. Here’s a quick breakdown:
- cont, c – Continue execution
- next, n – Step next
- step, s – Step in
- out, o – Step out
- pause – Pause code execution
There’s quite a few helpful tools listed, but I’ll just be touching on some of the more basic commands.
Stepping
One of the fundamentals of debugging is stepping in, over, and out of code. The three commands you want to get familiar with are next, step, and out. Those commands are n , s , and o respectively. Getting familiar with these is essential in being able to navigate through your code effectively to figure out what’s going wrong.
Breakpoints
The next essential tool of effective debugging is being able to set breakpoints. Those can be done one of two ways. The easier, straightforward way is to add debugger; (jshint to make sure these get removed before moving this code to production. The other way to set a breakpoint is to use the sb command provided by the debugger itself. This sets a breakpoint on the current line for the current debugging session. Do note that those will be lost when the debugger is exited.
Watchers
Lastly, watching a variable and see its values change over time. You can add a watch at any time even though the variable you want to watch isn’t in scope. Let’s say I want to debug this code:
function say(name) {
  debugger;
  var msg = 'Hello, my name is ' + name;
  console.log(msg);
}

say('Justin');
say('Steve');
say('John');
I’ve got a debugger statement in the say function, when I debug this code, I want to watch the _name_ parameter change as the function is called. The watch command is a function and takes the name of the variable as a string parameter. To setup our watch, we do this:

If you want to see all watchers you have setup, just run the watchers command. You’ll see above that name is currently defined as error. This is because there’s nothing called name in scope. If we let the program run and stop on the breakpoint, name will now have a value. Now anytime the debugger stops, it will show all watcher values above the code.

To remove a watcher, use unwatch the same way you used the watch command.
No More console.log
Hopefully I’ve given you enough to dive into the built-in Node debugger to help narrow down those bugs. Once I learned how to use it, debugging became that much easier in Node. Logging to the console is a tried and true method, but can become cumbersome when trying to troubleshoot advanced issues.
If this crash course wasn’t enough and you want to explore this more, WatchMeCode that will take you to that next level.